Post-pandemic data reveals ongoing increases in alcohol-associated liver disease — particularly among certain populations
Alcoholic liver disease (ALD) is a progressive and entirely preventable condition caused by excessive and chronic alcohol use. While irreversible forms of ALD such as cirrhosis typically take 10 to 20 years of sustained heavy drinking to develop, recent shifts in drinking patterns have led to higher rates among Americans under age 45 — resulting in higher rates of liver transplants and mortality. Even prior to the COVID-19 pandemic, ALD-related deaths were on the rise, increasing 43% from 2009 to 2015. This trend accelerated during the pandemic, when alcohol consumption surged. The CDC reported an ALD-related mortality rise of 26% between 2019 and 2020 and a disproportionate impact among women.
To better understand how these patterns have evolved in the years since the pandemic, we analyzed updated data through the end of 2023 — two years beyond the period currently covered by most national ALD studies. We leveraged Komodo’s Healthcare Map®, the industry’s most comprehensive and complete source of de-identified, real-world longitudinal patient data, to shed light on post-pandemic trends in ALD. Experian Marketing Services, a Komodo data provider, contributed the report’s social determinants of health (SDoH) data; in keeping with every dataset used, this information was fully de-identified. We used Komodo’s MapView® Cohort Report Template and custom analytics built from our MapLab® platform to analyze patterns based on age, gender, race, and payer channels. (In our analysis, the definition of ALD includes: alcoholic fatty liver; alcoholic hepatitis with and without fluid buildup in the abdomen; alcoholic fibrosis and scarring of the liver; alcoholic cirrhosis with and without fluid buildup; alcoholic liver failure with and without coma; and other unspecified alcohol-related liver conditions.) Here is what we found.
A significant increase in ALD was seen between 2022 and 2023 — comparable to the pandemic-era surge.
After an initial dip of 1% between 2017 and 2018, ALD rates began an upward trajectory from 2018 through 2023. Rates increased most during the pandemic, by 5% between 2019 and 2020, followed by a period of stabilization with negligible change through 2021-2022, and then a notable 4% increase between 2022 and 2023.
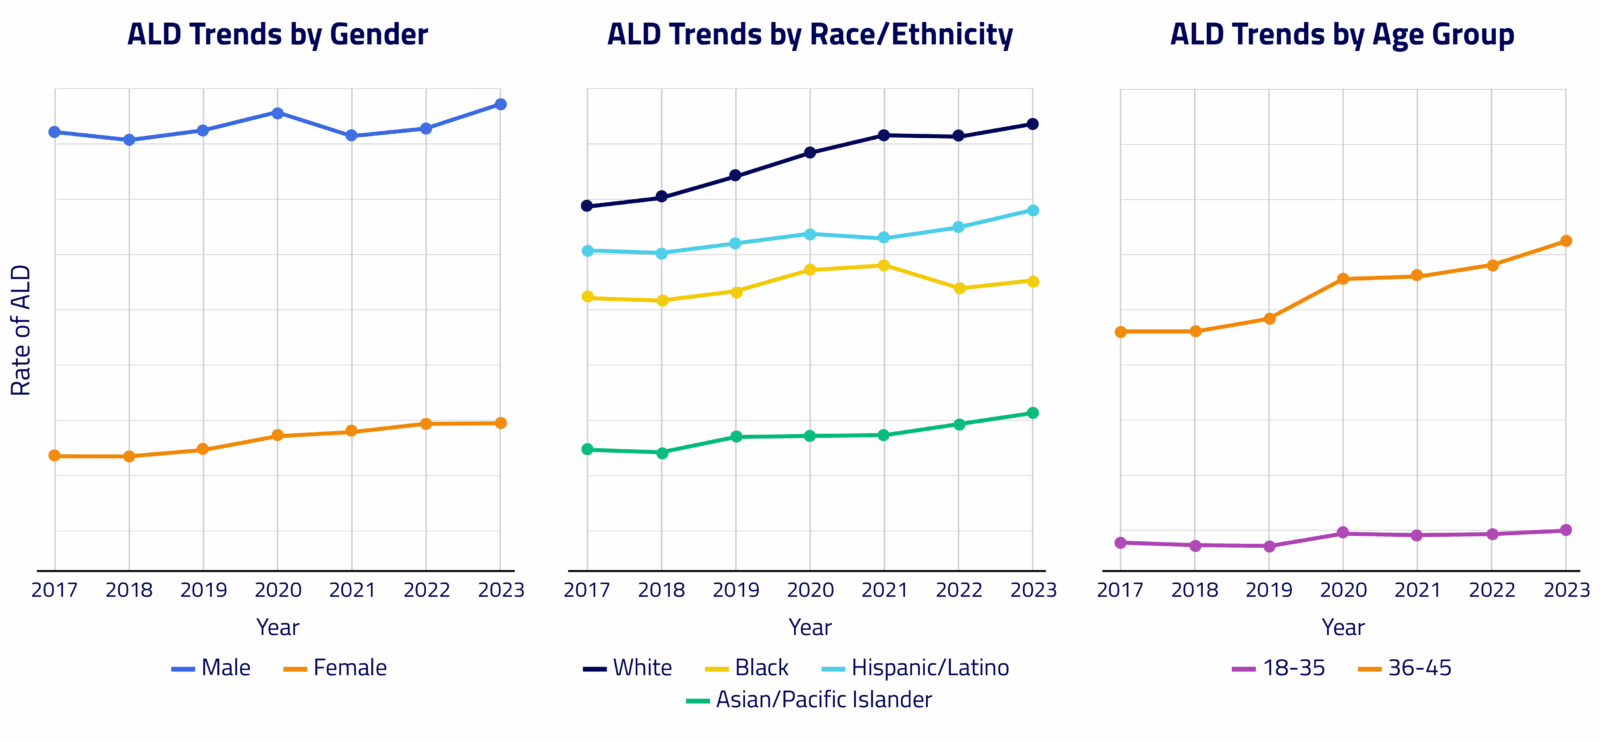
In women, ALD rates rose by 17% between 2017 and 2023 and continued to increase by 4% from 2021 to 2023, highlighting an ongoing post-pandemic increase.
While men had more than double the rate of ALD than women overall, the rates among women have substantially outpaced those of men, with a 15% rise between 2017 and 2023 in women vs 5% in men. The largest annual rate increase for women occurred between 2019 and 2020 (+7%), while men experienced the largest increase more recently, between 2022 and 2023 (+5%).
The rate of ALD in adults ages 18 to 45 — a group that saw significant pandemic-related increases — has continued to rise.
Between 2017 and 2020, rates among adults ages 18 to 35 increased by 12%, with most of that growth occurring during the pandemic period. In the 36 to 45 age group, ALD rates rose by 17% over the same time frame. Post-pandemic, the trend has continued. In the 18 to 35 age group, the rate rose an additional 4% between 2021 and 2023 (for a total of 15% over the seven-year period). In the 36 to 45 age group, ALD rates rose another 10% between 2021 and 2023 — a 29% increase over the seven-year period. By 2023, ALD rates in the 36 to 45 age cohort were more than 3.5 times the rate of those in the 18 to 35 group. This highlights both the severity of disease in this age group and the growing burden among younger adults overall.
Rates of ALD increased across all races and ethnicities, but Asian/Pacific Islanders had the greatest rise in recent years.
Asian/Pacific Islander (AAPI) patients had the lowest rates of ALD across all years in our time frame — less than half the rate of White patients — but they had the greatest rate of change in ALD, increasing 20% between 2017 and 2023. This population also had a significant single-year percentage increase of 9% between 2018 and 2019. White patients had the highest rates of ALD overall, followed by Hispanic/Latino patients and then Black patients. Between 2017 and 2023, the rate of ALD in White patients increased by 19%, in Hispanic/Latino patients by 11%, and in Black/African American patients by 5%.
SDoH and ALD
To explore potential social determinants of health (SDoH) that may influence ALD, we examined rates for the 2016-2023 period across several variables, including income level, access to care, marital status, and living alone vs. living with others. We also looked at total risk level* for this segment.
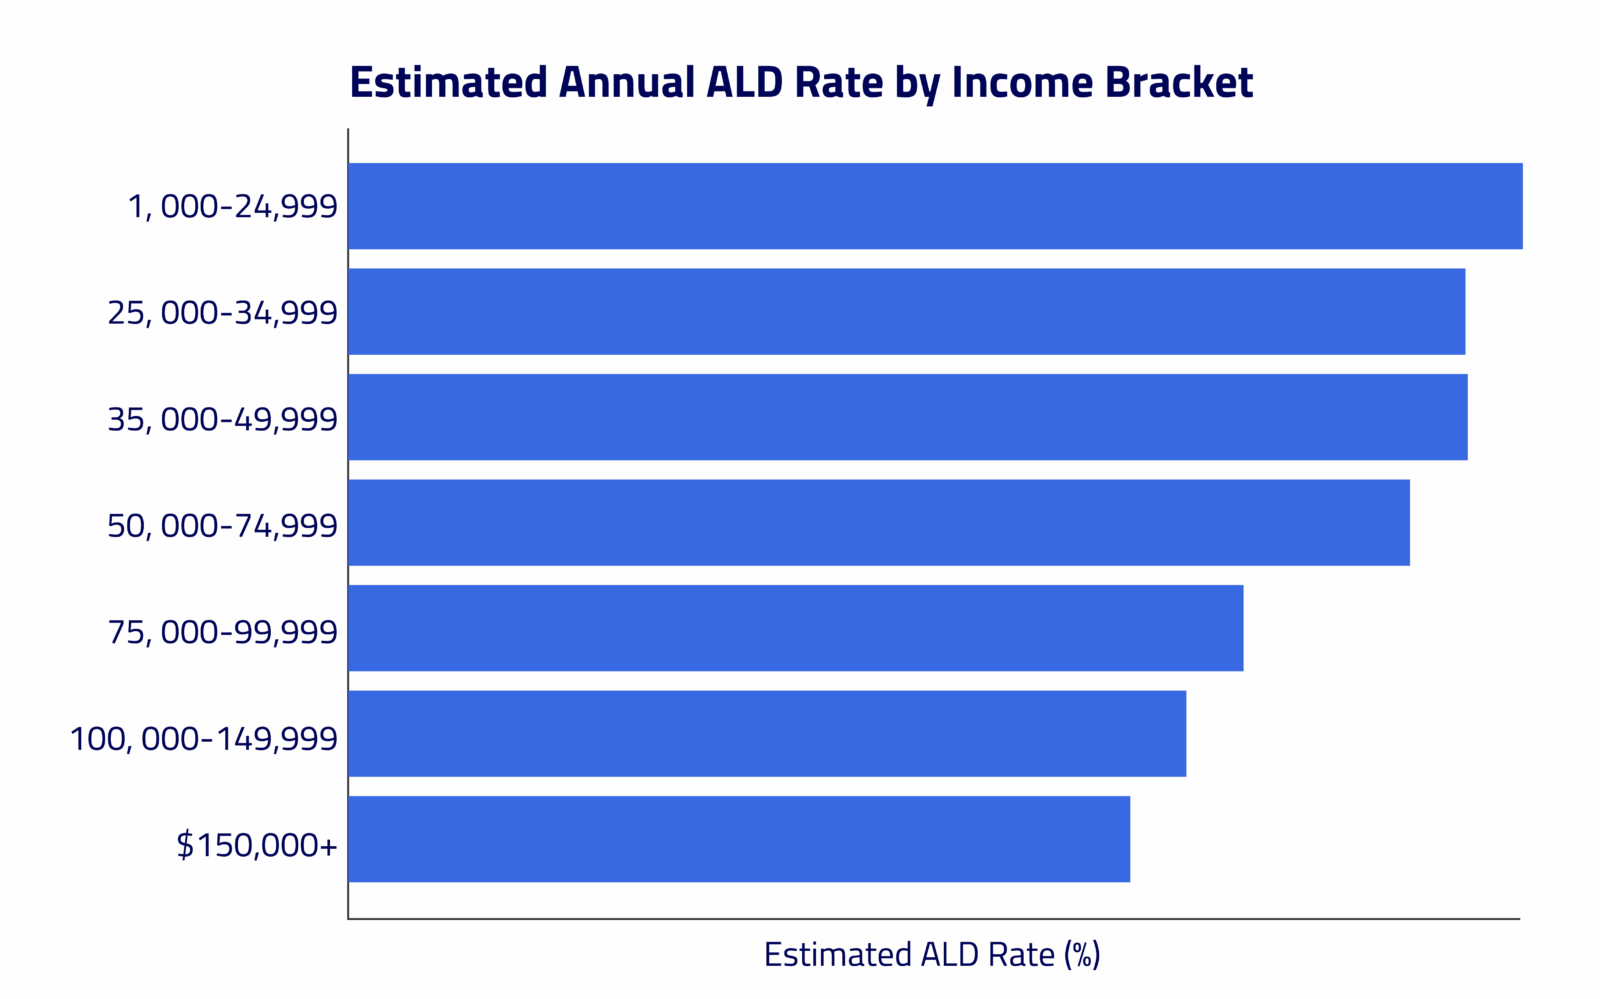
Patients in the lowest income bracket (<$25,000) had an ALD rate 53% higher than those in the highest bracket (>$150,000).
A significant concentration of ALD was observed in lower-income brackets; patients estimated to earn less than $75,000 a year constituted 73% of ALD patients. The rate for patients estimated to earn less than $25,000 was also higher than for other lower-to-middle-income brackets; for instance, it was 6% higher than for those estimated to earn $50,000 to $74,999.
Married individuals had a 28% higher ALD rate than those who were single.
This may largely reflect higher overall rates among older patient cohorts, as the overall ALD rate in adults age 36 to 65 is, on average, 4.5 times higher than in the 18 to 35 age group, and more individuals in the older cohort are likely to be married. Living alone corresponded with a 7% higher ALD rate compared to not living alone.
Patients with a high total SDoH risk level had an ALD rate 55% higher than those with a low total risk level.
The ALD rate for those with a high risk level was also 17% higher than for those with a medium risk level, a group whose rate was 33% higher than the low risk level group. A high risk level for access to care corresponded with a 26% higher rate of ALD vs. a low risk level. Patients with a high risk level for access to care made up 34% of the ALD patients for this category; their ALD rate was 10% higher than the medium risk level for access to care, and the medium risk group had a rate 15% higher than those with low risk.
Our analysis shows that the rise in ALD is not just a pandemic-era anomaly. It continues to evolve, with particular vulnerability among individuals in certain age, gender, and socioeconomic groups. Women and younger adults, particularly those facing systemic barriers tied to income or access to care, are emerging as key populations driving the post-2021 surge in disease burden. With the most recent spike in ALD rates mirroring the early pandemic surge, this moment represents a critical inflection point.
These findings underscore the importance of using real-world data to detect public health shifts as they unfold. Komodo’s platform integrates comprehensive patient-level insights with rich SDoH visibility, allowing stakeholders to see beyond clinical data and understand the broader context shaping outcomes. By illuminating the populations most affected by a trend, policymakers, health systems, and community leaders can be best equipped to intervene earlier, target resources more effectively, and develop solutions that reflect the full picture of patients’ lives, allowing them to curb a growing burden of disease — and save lives.
*Total risk score and level reflect the cumulative burden across key SDoH, including access to care, medication adherence, food insecurity, and housing instability.
To see more articles like this, follow Komodo Health on X, LinkedIn, or YouTube, and visit Insights on our website.


