The annual pink color splash that accompanies Breast Cancer Awareness Month is much more than a fashion statement or marketing campaign. It’s a coordinated public health effort to raise awareness about this devastating disease. The good news is that breast cancer awareness efforts are paying off: The number of women receiving regular mammograms has increased steadily since Breast Cancer Awareness Month launched in 1985.
That’s an important step forward in tackling the disease, as studies show that for women of all ages and at average risk, breast cancer screening is associated with a reduction in breast cancer mortality of approximately 20 percent. Accordingly, the American Cancer Society recommends that all women begin having yearly mammograms by age 45, switching to a biennial frequency at age 55 and continuing screening for as long as they are in good health.
Yet, on a nationwide basis, just 65% of women aged 40 and over report having had a mammogram within the past two years. Several studies have examined the barriers that keep women from receiving preventive screenings, exploring differences in guideline adherence between urban and rural settings and among different socioeconomic and demographic groups. But few have explored the variation in mammogram adherence rates at the individual patient level on a national scale.
To provide a more granular look at breast cancer screenings nationwide, we used our Healthcare Map™ to examine real-world patient data and identify patterns of mammogram adherence and regional concentration of breast cancer specialists in each county in the United States. The results show some stark regional differences in the concentration of the disease itself, adherence to preventive screening guidelines, and access to specialists.
Where is the burden of breast cancer highest?
Although cancer deaths have been on the decline nationwide, this trend reverses in certain geographic clusters. According to a 2017 JAMA study, the southern states along the Mississippi River have the highest concentration of breast cancer deaths. Our analysis supports those findings and also highlights areas such as central and southern Arizona and the southwest coast of Florida, which have older populations and some of the highest concentrations of breast cancer diagnoses.
Figure 1 highlights the demographic distribution of breast cancer across the United States.
Figure 1. U.S. breast cancer disease burden
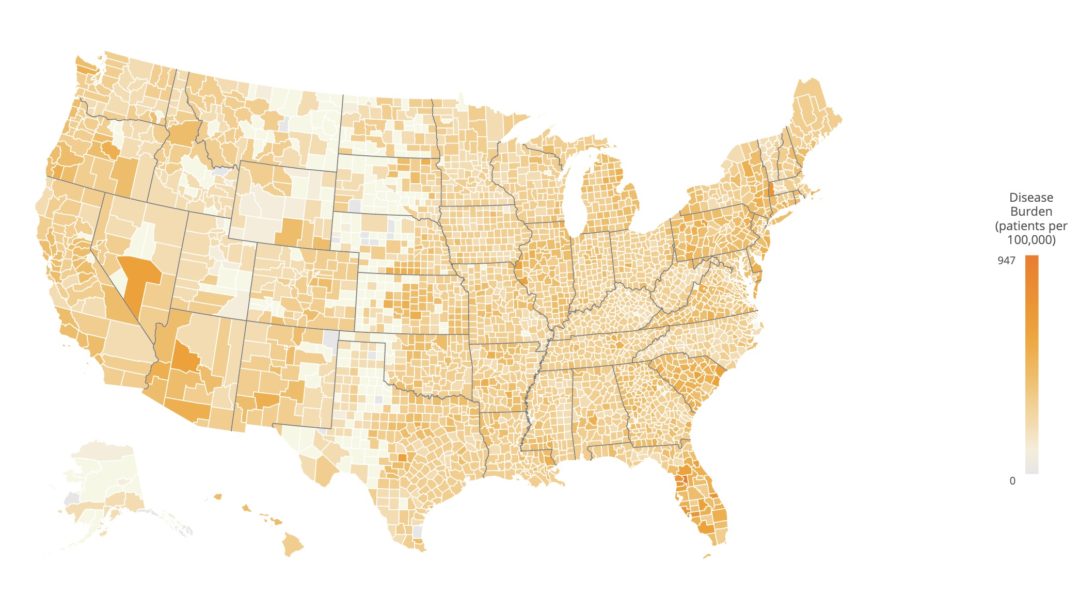
Source: Komodo Health
Where do mammogram adherence rates lag?
In addition to lowering mortality rates, mammography screenings lead to better outcomes. A landmark study published last November found that women who have participated in mammography screenings obtain a significantly greater benefit from the therapy available at the time of diagnosis compared with those who have not received mammograms. They explain, “Despite advances in treatment, women who participated in mammography screening had the added advantage of earlier detection and received a far greater benefit from less aggressive therapy than women who did not participate.”
Still, on a nationwide basis, more than one-third of American women are not being screened in accordance with recommendations. Figure 2 illustrates the total number of mammogram screenings conducted per 100,000 women aged 40-74 by county. Our findings illustrate screening rates on a county-by-county basis, noting that areas in central Alabama and central and western Texas have some of the lowest mammogram adherence rates among women ages 40-74. This correlates with research showing the lack of mammogram facilities in many rural counties, contributing to lower adherence rates.
Figure 2. Mammogram screenings per 100,000 women aged 40-74
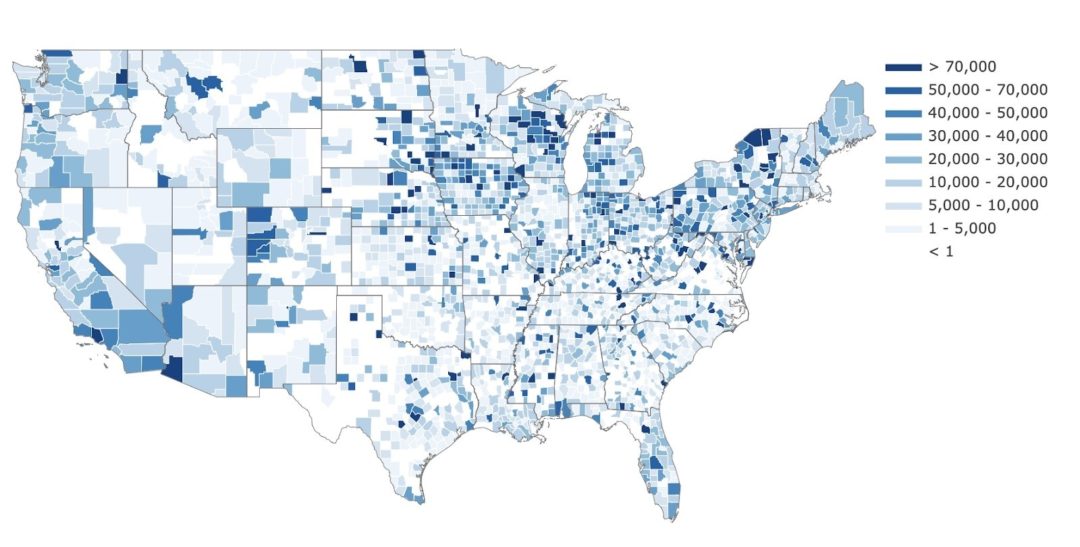
Source: Komodo Health
Where do patients have limited access to breast cancer specialists?
Local access to specialists is also a major factor in early detection and treatment of breast cancer, with studies showing that cancer mortality rates are significantly higher in rural areas. ASCO’s annual State of Oncology Practice in America, 2018 found that although 19% of the U.S. population lives in rural areas, only 7% of oncologists practice in these regions.
Komodo Health tracks the concentration of breast cancer specialists across the country, including oncologists, surgeons, and radiation oncologists. We found that populous urban centers, such as the New York metro area, southern Florida and southern California, have some of the highest concentrations of breast cancer specialists per capita, while less populous regions such as west Texas, southern Utah and central Idaho have some of the lowest.
Figure 3 illustrates the total number of breast cancer specialists per 100,000 people.
Figure 3. Breast cancer specialists per 100,000 people
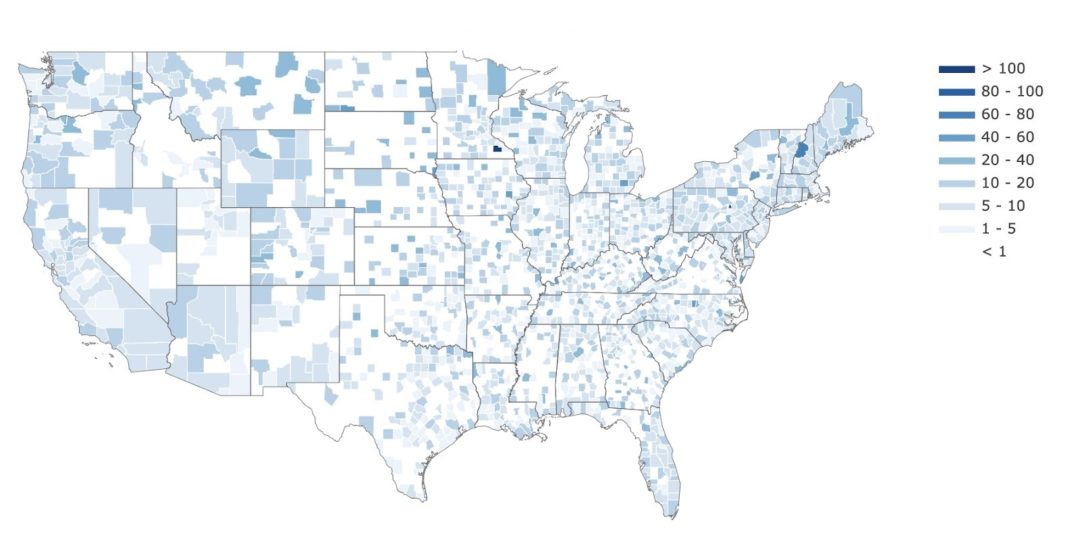
Source: Komodo Health
Going deeper with better data
This geographic snapshot of regional patterns in breast cancer diagnosis and access to care just scratches the surface of what’s possible with the deeper view that comprehensive, complete and current patient data provides, but it reinforces some important truths about the current state of cancer care. The disease burden is carried unevenly throughout the country, and efforts to address that burden are not always aligned with the areas that need it most.
Further research is required to probe deeper into the geographic variation in breast cancer screening and treatment, but this initial work should serve as an important reminder as we close out another pink-tinted October that we need reliable, patient-level data to support the fight against breast cancer. Only by reconstructing real-world patient journeys at scale can we hope to achieve the type of targeted, accessible interventions that will have a meaningful impact on breast cancer in the months and years to come.
This analysis relied on Komodo Health’s Healthcare Map™, which includes data for more than 320 million individuals, adding 15 million new clinical encounters each day. To produce these heatmaps, our team of data scientists evaluated healthcare encounters across the United States to identify patterns of diagnosis and screening, and to pinpoint the distribution of specialists across the population. These numbers were standardized to the 2017 Census population estimates and are based on a rolling 12-month cycle. To protect privacy, the findings are limited to the location where the medical service was provided rather than where a patient lives.


