Life Sciences leaders are at a crossroads. While 70% of executives acknowledge the need for speed, most organizations remain trapped in a grinding cycle of data drudgery, clean-up, fragmented tools, and months-long turnarounds. Following a recent webinar on this subject, we’ll further explore how Marmot™ delivers enterprise-wide ROI by collapsing workflows and transforming analytics from a slow-motion slog into a real-time strategic engine through two high-impact use cases.
The Hidden Cost of the Status Quo
Before quantifying ROI, it’s worth being honest about what conventional analytics workflows actually cost. Chad Forsey described the anatomy of the traditional analytical “slog” with surgical precision during the webinar, and it will resonate with anyone who has lived through it.
Phase one is procurement and alignment: one to four weeks of defining research questions, negotiating contracts, securing schedules, and navigating data access before a single line of code is written. Phase two is the engineering burden: weeks five through 12, when your most talented analysts manually map ICD and CPT codes, clean and normalize disparate data sources, and build cohorts from scratch. Phase three is the iteration lag: the part that never ends. Every follow-up question, every stakeholder refinement, every hypothesis restart sends the whole cycle spinning again.
“We have built a scalable AI infrastructure, so your team can stop acting as data wranglers and start acting as strategists.” — Chad Forsey, Komodo Health
The financial cost of this model is rarely aggregated into a single place, yet it compounds across every function. Engineering time is consumed not by strategic analysis but by infrastructure maintenance. And perhaps most damaging: decision-makers operate on stale data, making critical commercial and clinical choices without the real-time grounding they need.
Marmot was designed to collapse this entire workflow. But the ROI story is more nuanced and expansive than simple cost savings. It spans three distinct dimensions that compound across the enterprise.
The Three ROI Dimensions of Marmot
1. Velocity: From Months of Planning to Minutes of Inquiry
Marmot collapses the analytical lifecycle by instantly translating plain-language questions into research-grade pipelines. By eliminating the “procurement slog” of bespoke data engineering, teams can “double-click” into any finding — stratifying cohorts or pivoting hypotheses on the fly without new budgets or project cycles. This shifts analytics from a static, linear report into an iterative, live exploration that dramatically increases the volume of strategic questions an organization can pursue.
2. Evidence: Publication-Ready Transparency
Marmot replaces “black box” AI with fully auditable code. Every cohort and analysis is transparent, moving insights from “directional” to evidentiary-grade. This allows HEOR and RWE teams to generate internal analyses for AMCP dossiers and payer submissions with the methodological rigor required for publication, significantly reducing reliance on expensive external consultancies.
3. Adoption: Strengthening Payer and Commercial Narratives
Real-time evidence accelerates commercial performance by grounding brand differentiation in hard data. Whether demonstrating reduced hospitalizations or identifying treatment gaps, Marmot allows teams to update value narratives as fast as the market evolves. This agility transforms raw data into a competitive differentiator that moves the needle in payer access and formulary positioning.
Use Case Deep Dive: Multiple Myeloma HCRU
DEMONSTRATING THE HEALTHCARE BURDEN OF AUTOLOGOUS STEM CELL TRANSPLANT
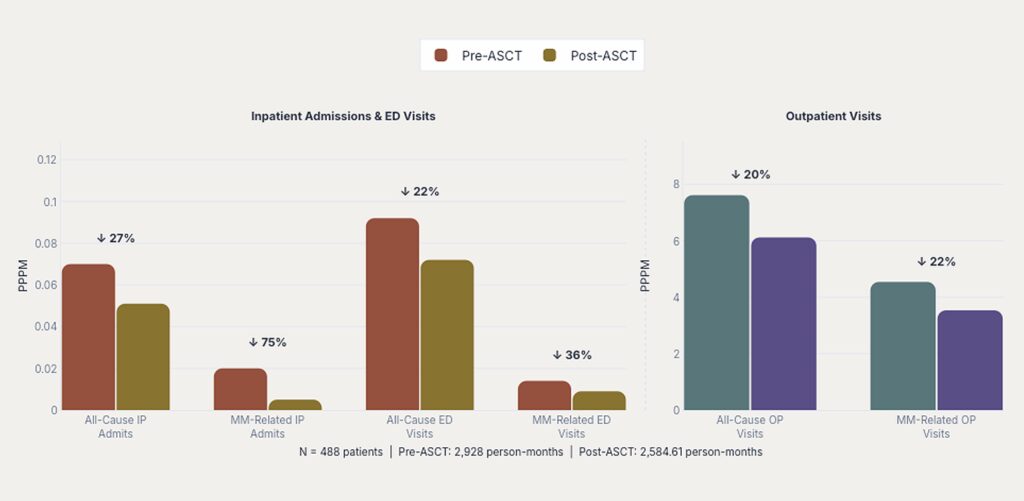
One of the foundational questions in multiple myeloma (MM) treatment strategy is how healthcare resource utilization (HCRU) changes around autologous stem cell transplant (ASCT). Understanding that pattern — what care looks like in the six months before versus the six months after — has significant implications for payers, providers, HEOR teams, and clinical development alike.
Answering that question through conventional methods requires months. A team would need to curate MM diagnosis and therapy code lists, extract and prepare claims data, build an ASCT cohort with complex eligibility criteria, aggregate HCRU outputs across pre- and post-analysis windows, run manual QA and validation cycles, and then iterate across stakeholders, often restarting the process when questions evolved.
Marmot ran the same analysis with its auditable methodology in near-real time.
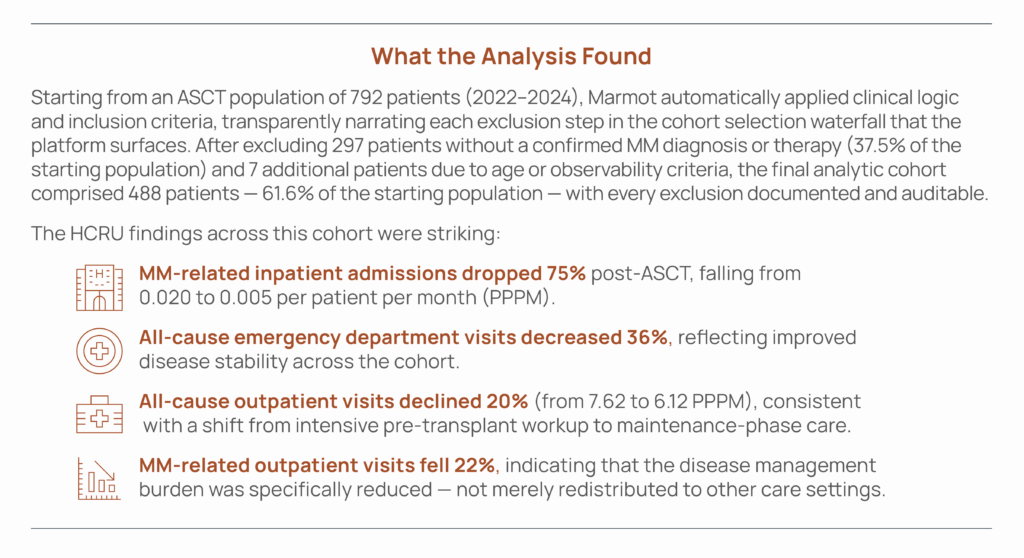
When translated into cost terms, the magnitude becomes clearer. Across the 488-patient cohort, the post-ASCT period was associated with approximately $1.6 million in total inpatient cost reduction (a 61% decrease over six months) and approximately $12 million in total outpatient cost reduction. Length of hospital stay per admission fell 50%, from 13.2 to 6.6 days.
Why This Matters Across the Organization
The same analysis speaks to fundamentally different strategic questions depending on who is reading it:
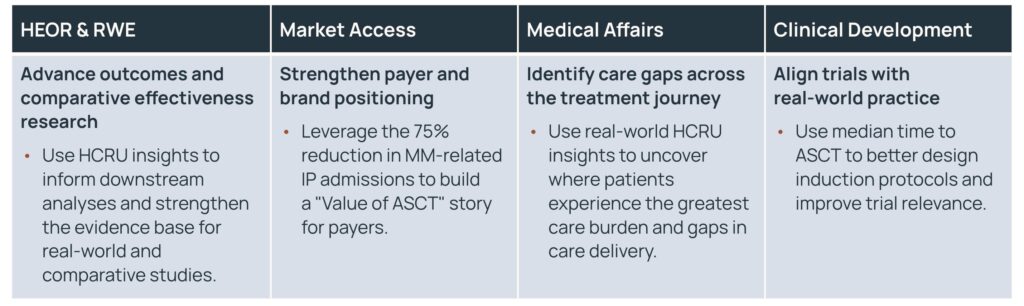
What was previously four separate consulting engagements — each taking months and costing hundreds of thousands of dollars — is now one unified analysis that each function can interpret through its own strategic lens, in real time, with shared methodological grounding.
Use Case Deep Dive: Primary Biliary Cholangitis Line of Therapy
MAPPING TREATMENT PROGRESSION TO IDENTIFY REVENUE OPPORTUNITIES
Primary Biliary Cholangitis (PBC) is a rare, progressive liver disease with a treatment landscape that has evolved significantly in recent years. Understanding how patients move through lines of therapy — who escalates, to what, and when — is essential for commercial teams, HEOR analysts, medical affairs, and clinical development alike. But constructing that picture from real-world claims data has traditionally been one of the most technically demanding analyses in Life Sciences.
The process requires curating diagnosis and therapy codes, extracting and reconciling claims data, building the PBC cohort with appropriate baseline criteria, defining the line-of-therapy logic, generating outputs and visualizations, and running QA cycles before any insight is actionable. Done traditionally, that is, months of bespoke work. With Marmot, the full analysis was produced in near-real time.
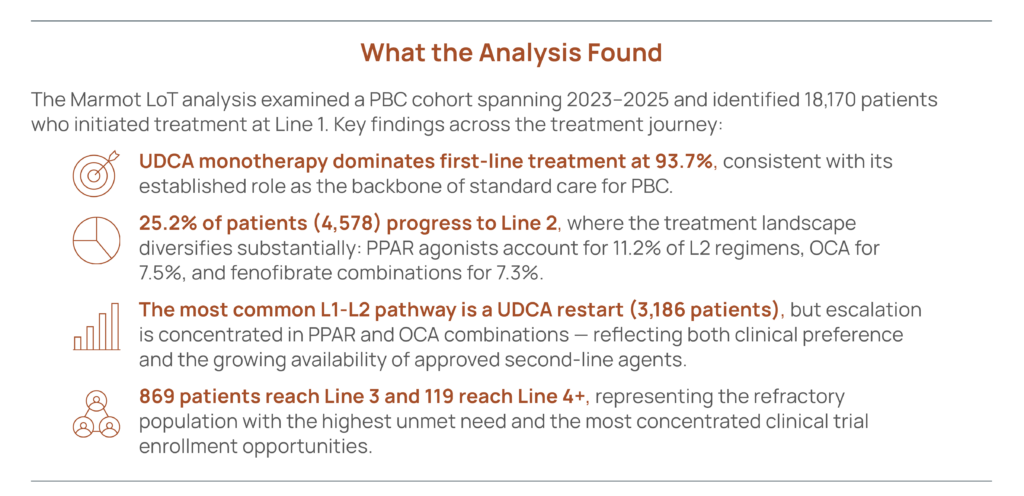
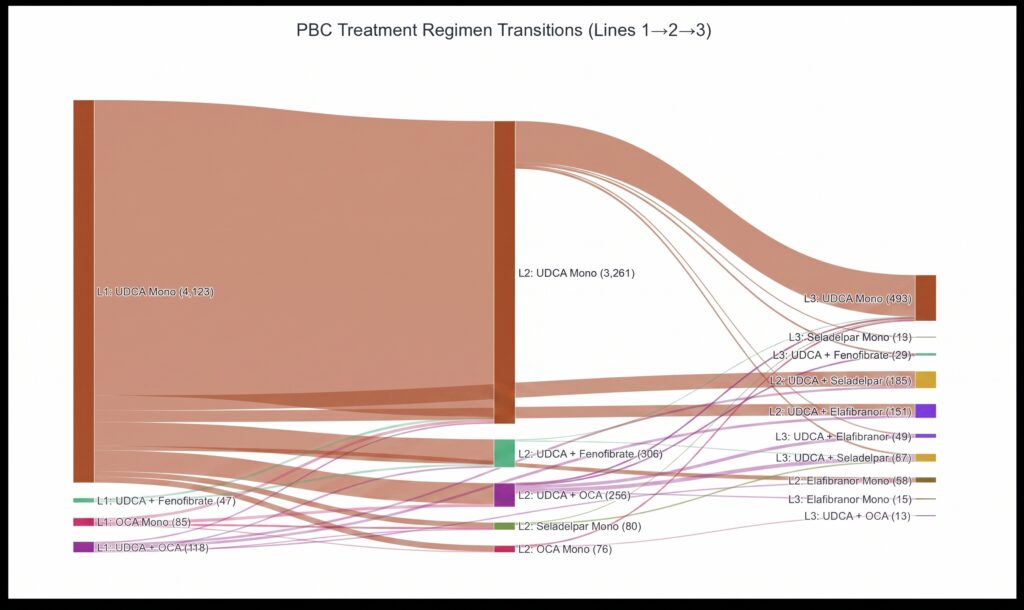
Marmot surfaced these findings with a Sankey diagram visualization showing treatment regimen transitions from L1 through L2 to L3 — making the flow of patient movement across therapies immediately interpretable by non-technical stakeholders.
The Commercial Revenue Opportunity
The line-of-therapy analysis doesn’t just describe the market — it quantifies the opportunity within it. Among the 4,578 patients at Line 2, 344 (7.3%) are currently receiving off-label fenofibrate combination therapy rather than a PBC-approved PPAR agonist such as elafibranor.
Marmot’s analysis makes the revenue implication explicit: With a 50–100% conversion rate of these patients to an approved PPAR therapy at an average annual cost of $138,000 per patient, the addressable incremental revenue opportunity is approximately $27 million to $47 million. That is a quantified commercial target, derived from real-world treatment data, available in near-real time — without a separate consulting engagement.
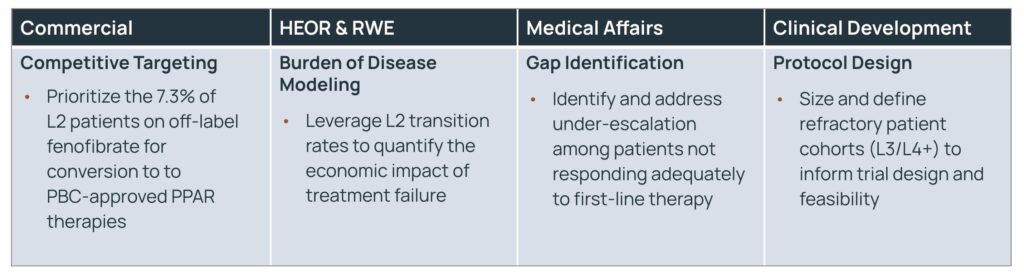
Why This Matters Across the Organization
As with the MM HCRU use case, the LoT analysis generates insights that translate differently — but coherently — across functions:
The Compounding Enterprise Effect
What both use cases demonstrate — and what the webinar began to articulate through the colorectal cancer example — is that Marmot’s ROI is not additive. It is multiplicative.
A single analysis, conducted once, with auditable methodology and near-real-time turnaround, generates value simultaneously across commercial, HEOR, medical affairs, and clinical development. What would previously have required four separate consulting engagements — each taking months, each potentially using different data cuts and methodological assumptions — is now a shared, unified source of truth that each function can interrogate through its own strategic lens.
Chad Forsey described this as the “gangbuster slide” moment: the point at which an insights leader realizes that the ROI from a single high-fidelity analysis doesn’t live in one silo. It feeds the entire organizational engine.
The analytics process becomes iterative rather than linear, and strategic conversations can be grounded in live evidence rather than retrospective reports.
For organizations operating at scale — with multiple brands, therapeutic areas, and functions competing for the same analytics bandwidth — this compounding effect is the difference between an AI tool and an AI platform. Marmot was built to function as the latter: not a point solution for a specific analysis type, but a full-stack infrastructure that transforms how an entire organization generates, shares, and acts on evidence.
A Practical Framework for Getting Started
To identify your high-velocity use cases, ask these three questions:
- Find the Slog: It is almost always visible, showing up as perpetual project backlogs, external consulting dependencies, and strategic questions that never get asked because the bandwidth to answer them doesn’t exist.
- Identify the Ripple: Where could one high-fidelity analysis create compounding ROI across commercial, medical, and HEOR simultaneously? The MM HCRU and PBC LoT examples above are both instances of analyses that “ripple” across the organization — generating evidence that is simultaneously useful for payer submissions, field-force targeting, care-gap identification, and trial design.
- Audit Your Tools: Are you relying on generalist LLMs that lack the clinical ontologies and domain intelligence required for healthcare analytics? Generic AI can feel like progress, but without AI-ready data — with the taxonomies, semantic layers, and healthcare-specific guardrails that transform a chatbot into a domain-expert collaborator — the outputs are directional at best and hallucinatory at worst. The distinction between a generalist experiment and an evidentiary-grade platform is not subtle. In high-stakes analytical environments, it is the difference between a tool you can trust and one you have to fact-check.
Conclusion
The webinar framed Marmot’s value proposition around decision velocity — the ability to move from raw question to defensible analytic output in minutes, not months. But the deeper ROI story is about what becomes possible when that velocity is available across an entire enterprise, simultaneously, with shared methodology and auditable outputs.
The HCRU analysis showed what a single transplant study can reveal about care burden — and how that evidence translates into $13.6 million in measurable cost reduction across a single cohort, while simultaneously informing payer strategy, medical education, and trial design. The PBC LoT analysis showed that treatment pattern data translates into a $27–47 million commercial revenue opportunity while simultaneously supporting burden-of-disease modeling, care gap identification, and refractory cohort characterization.
Together, they illustrate a principle that Forsey articulated clearly in the Q&A: Getting insights faster drives behavior, behavior drives performance, and performance — whether measured in reduced spend, increased patients treated, or stronger payer access — is unique to each team. The compounding ROI effect happens when none of that work lives in a silo, and the collective intelligence of the organization is optimized through a shared, AI-native evidence infrastructure.
That is the promise of Marmot. And based on the use cases above, it is no longer theoretical.


