
When a patient presents with knee osteoarthritis, the journey to knee replacement touches physical therapy, imaging, specialist visits, and surgery. At every step, some of that care may leave the health system. For providers, that can mean lost downstream volume and service-line revenue; for payers, it can mean less control over site of care, network performance, and episode costs — particularly under bundled or value-based payment arrangements.
How we used Marmot™ and Healthcare Map®: The Healthcare Map provides a longitudinal, all-setting view of the knee OA journey across the observable insured population. Each patient was anchored to the health system associated with their qualifying in-system orthopedic knee OA consult — the index event used to define the originating HCO. From that starting point, the analysis tracked downstream physical therapy and primary knee replacement, showing whether care stayed within the originating system or moved elsewhere, and which providers and organizations captured the leaked volume.
Marmot added episode-cost context to help size the financial importance of observed leakage. Together, the tools turn leakage measurement into a focused, repeatable analysis: leaders can compare the financial importance of different leakage patterns and monitor whether retention efforts are changing where care is delivered.
Why It Matters: Care Outside the Four Walls Is Difficult to Manage
A health system can directly view only the care within its own system. When patients receive downstream care from an independent PT clinic, surgery center, or competing hospital, that activity may be invisible to the originating system — even though it can affect retention and downstream volume.
The Healthcare Map fills this blind spot by following de-identified patients across providers, settings, and payers represented in the data.
Seeing beyond the four walls turns guesswork into strategy. For health systems, that means prioritizing access, capacity, affiliation, outreach, and referral or network-design investments; for payers, it means sharper network adequacy and tiering decisions, site-of-care steerage, and cleaner performance tracking on bundled or value-based arrangements.
How It Works: From Initial Consult to Retained or Leaked
The analysis follows patients down two independent downstream pathways from a single in-system starting point. The index system is the health system where the qualifying in-system orthopedic knee-OA consult occurs; downstream care is classified relative to that starting point.
Knee OA Consult. A patient’s earliest in-window claim that carries a knee-OA diagnosis (ICD-10 M17), is rendered by an orthopedic provider, and is attributable to the originating system’s roster — i.e., their first orthopedic OA encounter at that system.
PT leakage. Patients who received PT within the system but also sought knee-OA physical therapy elsewhere within a defined follow-up window (180 days in the reference analysis), a fragmentation and convenience signal.
Surgical leakage. Patients who progressed to a primary total knee replacement (TKA) and had the surgery performed outside the originating system, the high-value defection.
Why these are different stories. PT leakage is dual utilization, not defection (patients using the system and an outside provider), while surgical leakage is a clean win/loss on the highest-value episode. They answer different questions, so the analysis keeps them separate rather than blending them into one rate.
The Opportunity: What a Knee OA Leakage Analysis Reveals
Illustrative results from a three-system reference analysis. Results for an individual system will differ; these figures show the shape of the insight.
| Signal | Figure | What It Means |
|---|---|---|
| PT Leakage | ~1 in 3¹ | Roughly a third of patients who start physical therapy in-system also receive knee-OA PT somewhere else, a steady, high-volume spillover. |
| Surgical Facility Leakage | A low-single-digit share | A smaller share progresses to a total knee replacement and have the surgery at a facility outside the originating system – lower volume, but the highest-dollar leak. |
| Where the volume goes | By Organization | For most leaked patients, the analysis can identify the receiving organization, turning a leakage rate into a concrete action list. |
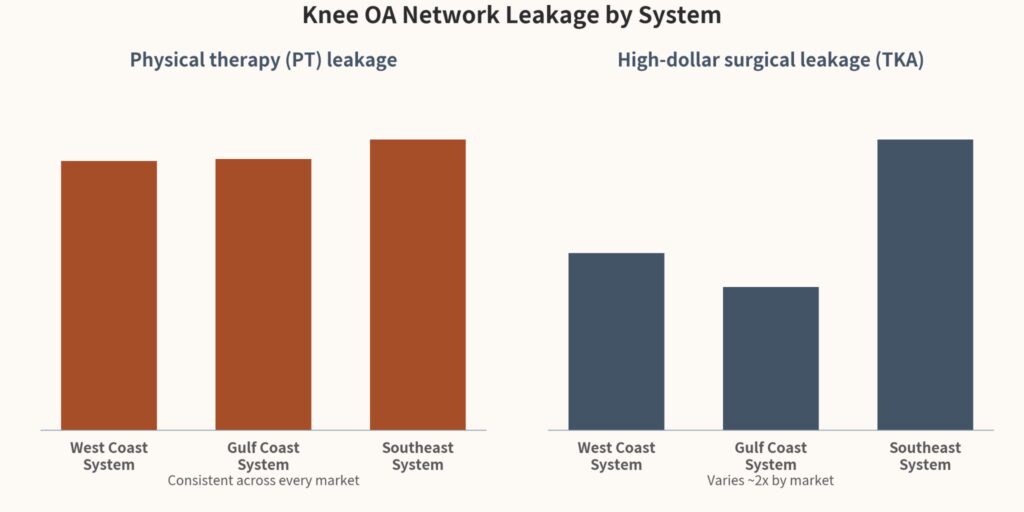
Network leakage in the knee OA pathway shows two distinct patterns depending on where in the journey it occurs.
Physical therapy leakage is a common structural pattern . Across all three reference systems, roughly a third of patients who begin PT in-system also receive knee-OA PT elsewhere, and the rate barely moves from market to market — a consistent feature of how early musculoskeletal care is delivered, not a system-specific failure.
Surgical leakage is where markets diverge. The share of patients who progress to a total knee replacement done outside the originating system varies by roughly 2× across the three systems — lower-volume but the highest-dollar leak. That spread reflects differences in local competition, access, and referral patterns rather than a quality judgment about any single system.
The Strongest Signal: The Destination of the Volume Is Visible
Leaked care rolls up from individual providers to named organizations, with parent-health-system context where a reliable parent relationship exists. Some independent providers, PT clinics, and surgery centers may remain identifiable only at the individual-provider level.
External PT: fragmented local absorption. PT leakage scatters across many convenient independent clinics and therapy groups, rather than one competitor.
External surgery: concentrated competitive loss. Surgical defection concentrates into a short list of identified competitor hospitals, ambulatory surgery centers, and orthopedic groups.
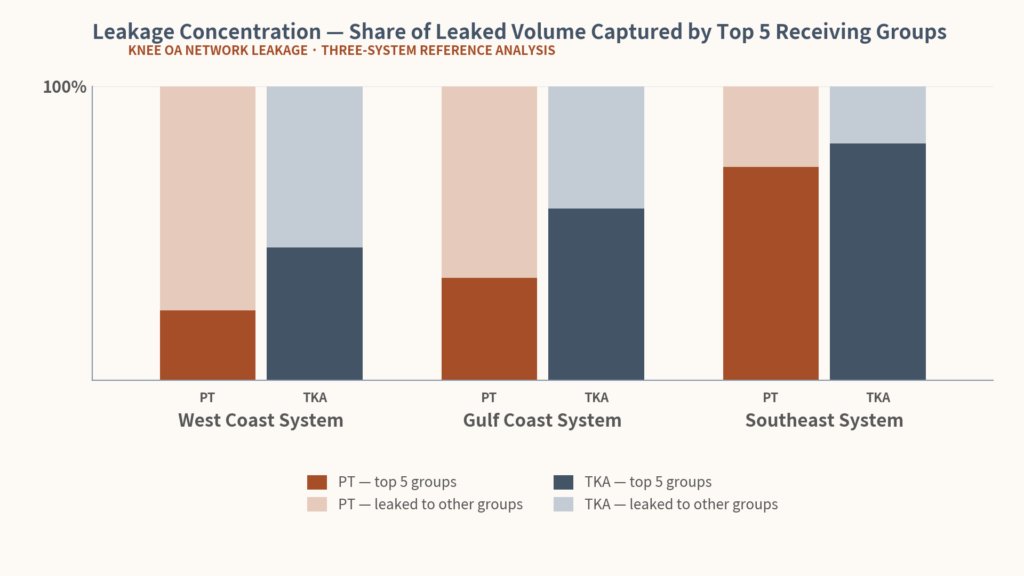
Share of leaked volume captured by each system’s top receiving groups, by pathway.
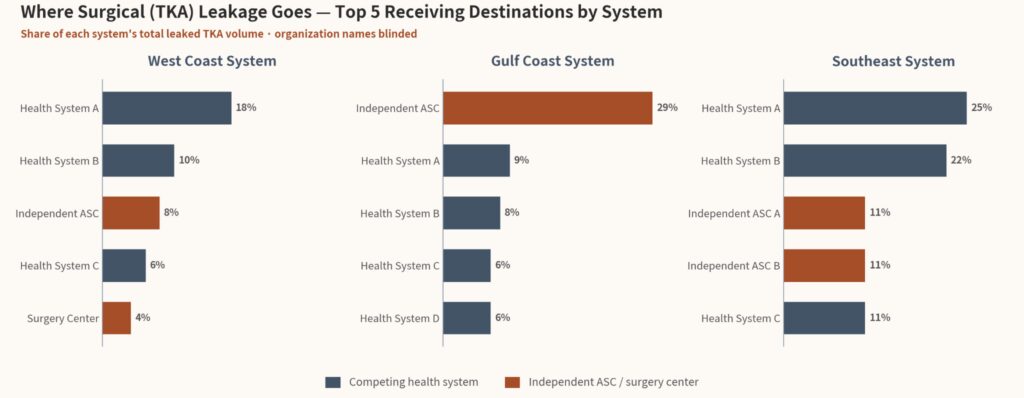
Top surgical (TKA) leakage destinations per system, blinded by organization type. Names withheld; type and share retained.
From number to action. Identifying destinations turns a leakage rate into an operating plan: it shows which levers matter the most for each destination, and lets leaders track whether targeted actions change the flow of care.
Sizing and Prioritizing the Financial Opportunity
Leakage volume becomes a stronger business case when paired with episode economics. Marmot and Healthcare Map translate observed leakage into directional financial opportunity, compare modeled episode benchmarks with observed paid amounts where available, and account for the broader components of a knee-replacement episode — facility, professional, anesthesia, and implant-related costs.
The same leakage rate can carry very different financial weight depending on payer mix and procedure pathway. In this analysis, Medicare carried the greatest leakage volume, while commercial episodes carried the greater financial opportunity. Where observed paid amounts are available — most reliably for continuously enrolled members — they provide the strongest, most market-specific view; Komodo’s Estimated Allowed extends the estimate to episodes without observed paid data and is best used to prioritize and build the business case.
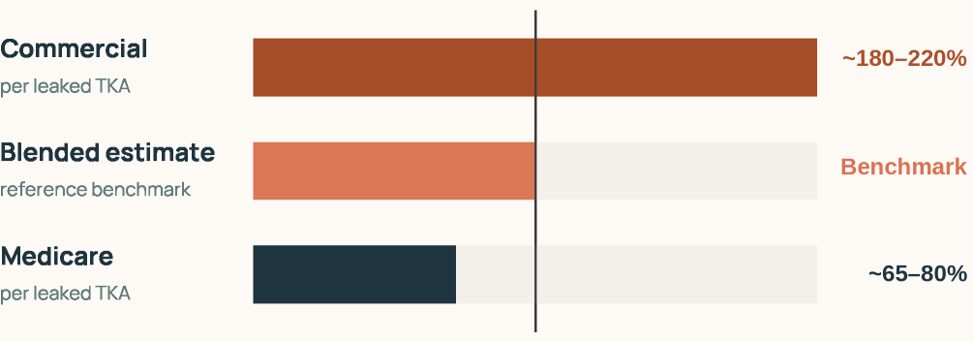
Observed cost per leaked knee replacement (CPT 27447 only),shown directionally relative to a blended benchmark. Illustrative; varies by market.
The Healthcare Map and Marmot make it possible to layer in far more detail than a single leakage rate: by type of coverage and individual plan, by each step in the care journey (physical therapy, imaging, injections, specialist visits, and surgery), by where the care happens (a hospital outpatient department, a surgery center, or an inpatient stay), by which competitor is capturing the volume, and by market. The more of these layers a system adds, the sharper its decisions become — where to add capacity, who to partner with, and where to focus outreach to keep patients close to home.
From Insight to Measurement
The analysis can also establish a baseline for action. After any interventions, the same pathway can be rerun to ask whether external PT dual use is changing, whether in-system TKA capture is improving, whether priority destinations are receiving less volume, and whether the payer mix or directional value of retained episodes has shifted. Tracking the same measures over time creates a feedback loop between strategy and observed patient movement rather than leaving the analysis as a one-time snapshot.
Built to Extend Beyond Knee OA
The same framework can extend beyond Knee OA. Once the entry point, retained-versus-leaked definitions, destination attribution, and episode economics are established, the approach can be used for other high-value service lines where patients move across hospitals, outpatient departments, surgery centers, specialists, or independent practices. That makes the work more than a one-time leakage study: it becomes a repeatable way to understand where care is moving, determine which leakage matters most financially, and which parts of the network are best positioned to retain it.
See the leak. Identify the destination. Size the opportunity.
¹“~1 in 3” is calculated among addressable PT patients—front-door knee-OA patients who received knee-OA PT within the originating system during the 180-day follow-up window. The numerator is the subset who also received knee-OA PT from an external provider during that window. This is a dual-utilization or partial-leakage rate, not the share of all front-door patients who left; patients who received only external PT and no internal PT are excluded from both the numerator and denominator.