Joint replacement may be an early signal of a much broader shift in where surgery is performed. In its 2027 proposed payment rule, CMS proposed adding 618 codes to the ASC Covered Procedures List and removing 637 procedures from the inpatient-only list; CMS expects the remaining services to be removed in 2028, completing the third and final phase of the phaseout. (CMS-1850-P). If finalized, the proposal could create a broader runway for procedures to move into outpatient settings over time — although many procedures would still be performed in hospitals for the foreseeable future.
Over the past five years, elective knee and hip replacement has moved steadily out of inpatient hospitals and into hospital outpatient departments and stand-alone surgery centers. The number of surgeries has been broadly stable after a post-COVID rebound, but where they happen — and the decisions that follow — have changed materially.
For payers, the shift affects site-of-care economics, reimbursement, network strategy, patient steerage, and access planning. For providers, it raises harder questions: where to add capacity, how to balance inpatient and ambulatory resources, whether to invest in or partner with surgery centers, and how to position orthopedic service lines for the next wave of demand. It also raises a more immediate financial concern: as more procedures become payable in outpatient settings, hospitals may face a loss of inpatient reimbursement and pressure on service-line economics. For anyone forecasting utilization, capacity, or cost, the key question is not only how many procedures will occur, but where they will occur, how quickly that mix is changing, and what it means for reimbursement.
How we used Marmot™ and Healthcare Map®: Healthcare Map, built on closed and open claims, provided the longitudinal, all-setting, de-identified patient journey view of elective knee and hip replacement across the observable insured population. Marmot, our healthcare-native AI analytics platform, then turned that foundation into an end to end analysis — separating procedure volume from site of care, surfacing the market drivers, and helping frame a grounded perspective for the next planning cycle. Together, they make the analysis easier to review, rerun, and extend to other procedures and markets.
Dissecting the Market
1. Volume: A Rebound, Then a Broadly Stable Market
HEADLINE FINDING
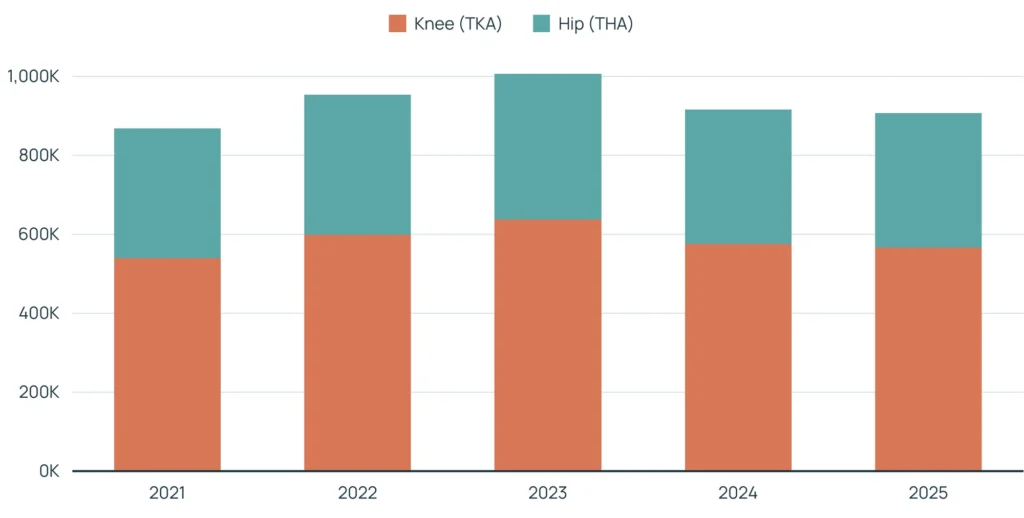
Elective knee and hip replacement volume rose from a COVID-depressed 2021 base to a 2023 peak, then eased in 2024–2025. The five-year pattern is best described as broadly stable with a temporary rebound — not as a sustained surge.
How Often Surgery Happens, by Year
Elective knee and hip replacement episodes by year; knee and hip shown separately.
Market context and caveats
The TJA rate per 1,000 member-years increased from 2021 through 2023 as deferred procedures returned, then leveled off in 2024 and 2025.¹ The modest easing after the 2023 peak reflects normalization following the rebound, with procedure volume remaining consistent with the observed member population rather than indicating a sustained decline in TJA demand.
2. Site of Care: A Sustained Shift out of Inpatient Care
HEADLINE FINDING
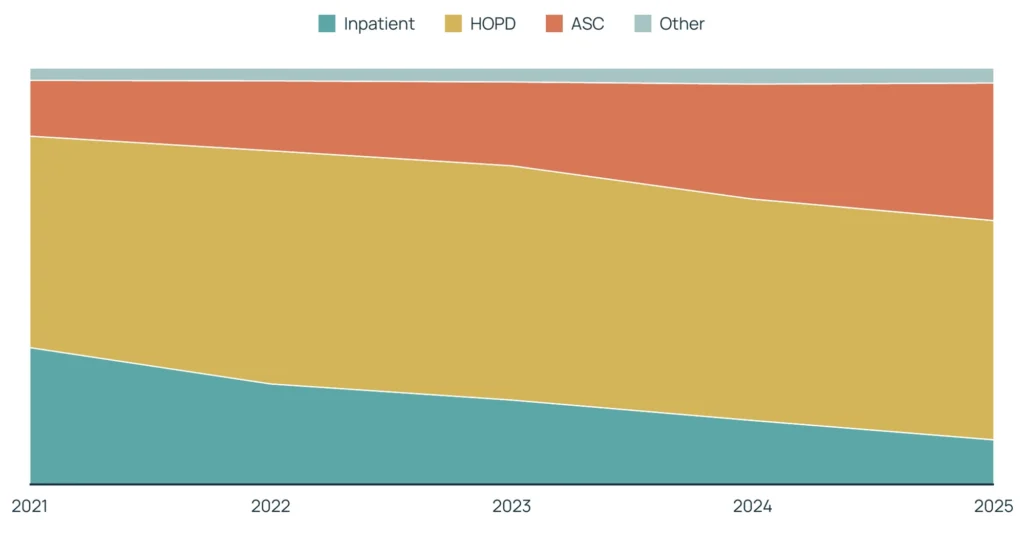
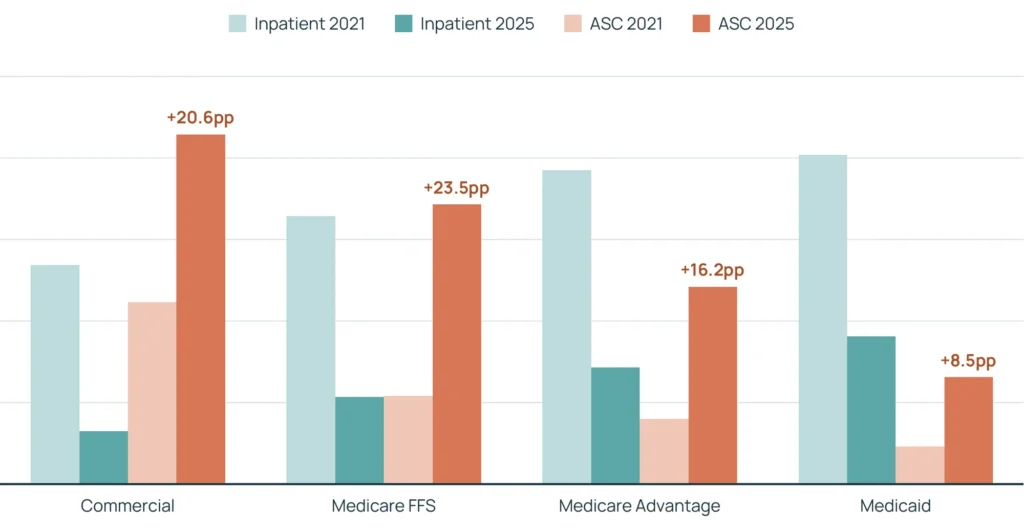
ASC share gained 20 percentage points over the observed period, roughly 2.5 times the 2021 share. That increase came largely at the expense of inpatient care, whose share fell 22 percentage points. HOPD remained the largest setting, staying broadly stable at about half of the market.
Where These Surgeries Happened, by Year
Setting mix of all elective knee + hip replacements. Inpatient = overnight hospital stay; HOPD = hospital outpatient department; ASC = stand-alone surgery center.
Market context and caveats
Part of the shift is regulatory and part is clinical. Medicare removed total knee replacement from its inpatient-only list in 2018 and total hip replacement in 2020. Better anesthesia, minimally invasive techniques, and same-day recovery protocols also made outpatient treatment appropriate for more patients. The hospital-to-outpatient movement is partly a billing reclassification within the same hospital; the further move into stand-alone surgery centers is the clearer change in where care actually occurs.²
GEOGRAPHY
The map adds a market-level lens to the site-of-care trend. ASC share increased at different rates across patient-residence states, creating an opportunity to identify markets with stronger migration, compare local patterns, and connect them to ASC supply, Certificate-of-Need rules, network design, and patient mix.
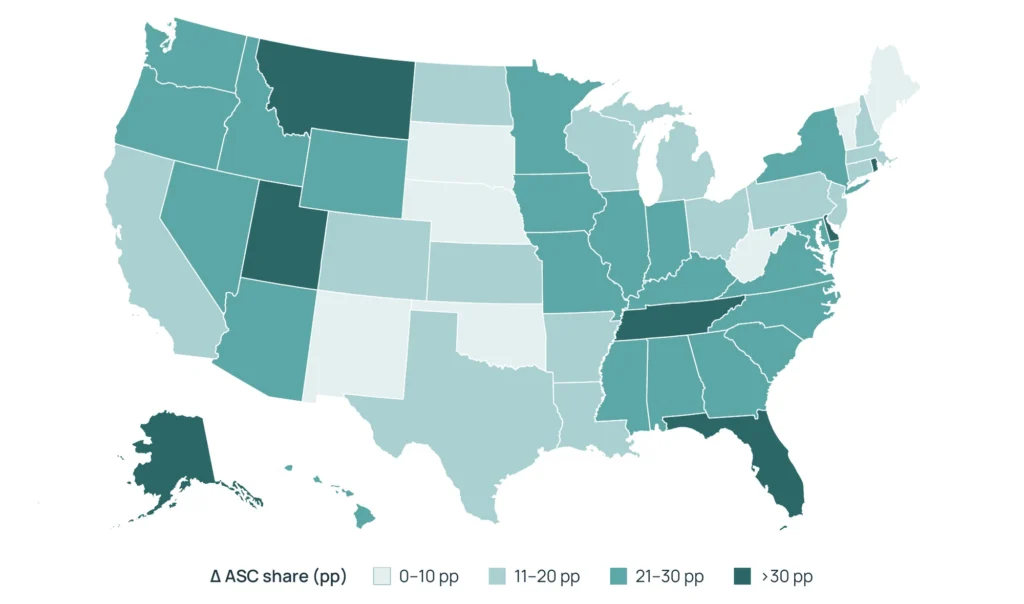
Change in ASC share of elective knee and hip replacement by patient state, 2021–2025. Lightest = lowest increase (0–10 percentage points); darkest = highest increase (>30 percentage points). States with fewer than 500 episodes in either year are omitted
Why the geography matters
- Build site-mix and unit-cost assumptions region-specifically, not from a single national average.
- A national average can overstate savings in slow-migrating markets and understate remaining runway in fast-migrating markets.
- Treat small-volume states cautiously because a handful of cases can materially change the migration bin.
PATIENT SEVERITY MIX
Across years and settings, the severity distribution sorts consistently: the sickest and most complex patients remain concentrated in inpatient care, lower-acuity patients are more likely to receive surgery in ASCs, and HOPD falls between them.
Patient Severity Mix by Year and Site of Care
12-month pre-index Elixhauser comorbidity count buckets across inpatient, HOPD, and ASC settings. The ordering is consistent across 2021–2025: inpatient is the highest-acuity venue, ASC the lowest, and HOPD falls between them.
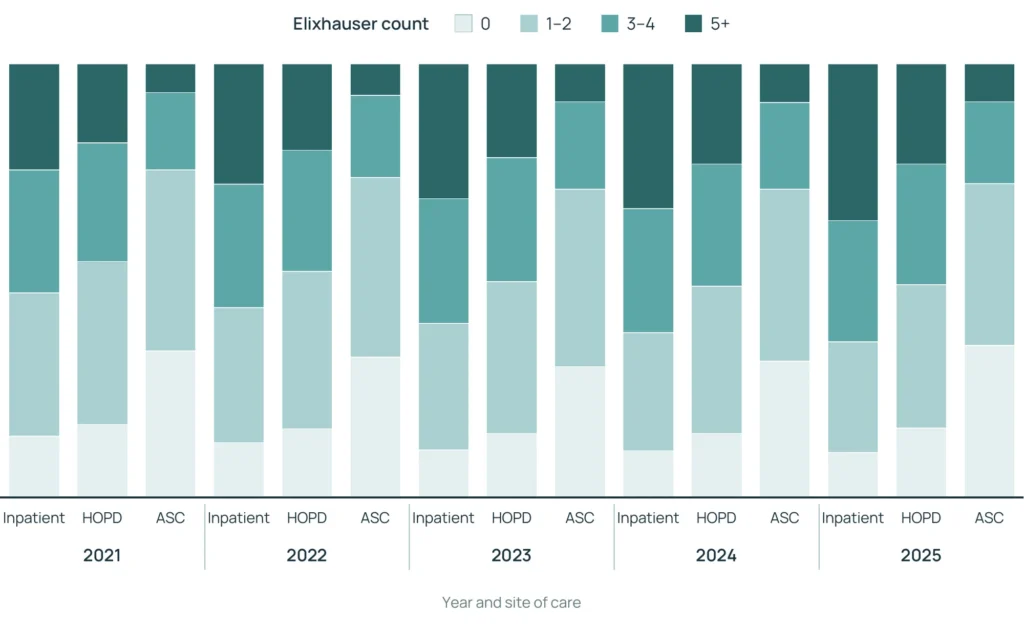
Patient severity mix by year and site of care (12-month pre-index Elixhauser).
What the severity pattern means
The distribution provides another planning lens: inpatient care continues to serve higher-acuity cases, while lower-acuity patients are more represented in HOPD and ASC. Pairing severity with geography and coverage type can help identify where outpatient pathways may continue to develop.
Future Outlook: Continued Utilization Growth and Site-of-Care Evolution
The outlook for the next year is modest utilization growth alongside continued evolution toward outpatient settings. The pace will vary by payer, geography, and patient acuity. The severity distribution indicates that inpatient care will continue to play an important role for higher-complexity patients, while HOPD and ASC pathways can continue to develop for appropriate lower-acuity cases.
For future year planning, treat utilization and site of care as separate assumptions and recombine them by payer and region. Medicare FFS and commercial coverage show the largest changes, while Medicaid moves more gradually, so the mix may evolve at different rates across coverage types.
What We Showed Here
Joint replacement is the example, but the pattern may extend well beyond one procedure category. As policy, clinical practice, and patient selection expand the range of procedures that can be performed safely outside the inpatient setting, stable demand can coexist with meaningful movement across sites of care. The planning question is not only how many procedures will occur, but where they are most likely to occur — and how quickly that mix may change.
See the Whole Market
Because Healthcare Map spans providers and payers nationwide, you can size the market for a procedure across hospitals, surgery centers, and clinics instead of seeing only the patients in one book.
Separate Volume from Site of Care
Volume tells us how many procedures occur; site of care tells us where they occur. They are complementary — not directly comparable — measures. Together, they show why a stable procedure count can still require a different plan.
Classify the Setting Consistently
Every procedure is sorted into inpatient, hospital outpatient, or surgery center using the same rules across claim types and years. That consistency makes a multi-year trend more trustworthy than one driven by coding differences.
Slice It the Way the Business Thinks
The same trend can be cut by joint, coverage type, age, geography, and patient acuity so decision-makers can see where outpatient pathways are developing and how market conditions vary.
Use a Transparent, Defensible Methodology
Every figure traces back to source claims through consistent, documented rules, creating a clear line from raw data to result rather than a black box.³
Follow the Patient Over Time
Because patients are linked across settings and years, the same foundation can extend to who is doing the surgeries, where patients go next, and how many return for a revision.
Elective joint replacement illustrates how a stable procedure market can still require a different planning approach. Volume and site of care are distinct but complementary lenses: one describes how many procedures occur, while the other shows where care is being delivered. By adding coverage type, geography, and patient severity, Healthcare Map and Marmot help identify how that pattern varies across markets — and where outpatient pathways may continue to develop.
¹Member-years measure the amount of insurance coverage observed, not the number of people. One member-year equals one member covered for a full year; a member covered for six months counts as half a member-year. Using member-years as the denominator lets us express utilization as procedures per 1,000 member-years, which adjusts for changes in the size of the observable population from year to year and puts every plan type on a comparable footing.
²Marmot’s literature review found directionally consistent evidence of moderated post-pandemic utilization growth, continued movement toward outpatient and AC care, and lower-acuity patients more often receiving ambulatory care. It also identified recurring payer and provider filing themes around outpatient strategy, ASC capacity, and site-of-care planning. These sources provide context; the Healthcare Map remains the basis for the estimates in this analysis.
³All figures cover elective primary total knee (CPT 27447) and total hip (CPT 27130) replacement plus matching inpatient joint DRGs across the observed analysis window and the observable insured population in Komodo Health®’s Healthcare Map. Per-capita rates use member coverage periods. Revisions, partial and unicompartmental procedures, hemiarthroplasty, and acute trauma are excluded. The analysis is descriptive and contains no cost dollars; the mix of care settings is used as a proxy for how blended cost per case is moving. Percentages and counts in this external view are intentionally presented as directional ranges.
Interpretive context. 2021-2023 reflects a rebound following pandemic-related deferrals; the 2022–2024 pattern is therefore the clearest reference for underlying utilization.
Panel and rates. Rates are conditional on the Komodo-observable insured population. Trend and within- or cross-plan comparisons are intended for relative interpretation; absolute national rates are not the intended use.
Site of care. Setting is inferred consistently from place of service, bill type, and DRG; the “Other” category is approximately 4% of 2025 procedures after bill-type backfill. The inpatient-to-HOPD movement includes both care-setting evolution and billing reclassification associated with CMS inpatient-only-list changes (TKA 2018; THA 2020).
Inpatient capture. Inpatient TJA is identified through major-joint DRGs anchored on hip and knee osteoarthritis.
Attribution. Dual-eligible episodes are attributed to Medicare using COB-primary, applied consistently to numerator and denominator. Approximately 2% of episodes without a resolvable coverage span and 1% Medicare-unspecified-segment are included in total volume and excluded from rates.