

Thanks to data science, commercialization has been completely transformed over the past 20 years. Today’s companies understand consumers almost as well as consumers understand themselves, and can target them with laser precision to efficiently — and even proactively — meet their needs.
Unfortunately, the healthcare industry has lagged behind in this evolution. The unique challenge of culling, synthesizing, and deduplicating data from myriad sources and making it readily accessible via a single resource while protecting patient privacy has been an enormous hurdle. Thankfully, pharma is now on the cusp of leveraging the same level of data-driven sophistication that has benefitted other industries.
Out With the Old: Dependence on Projections and Prescriptions
Historically, the basic formula for gleaning and leveraging insights to drive commercial strategies has included:
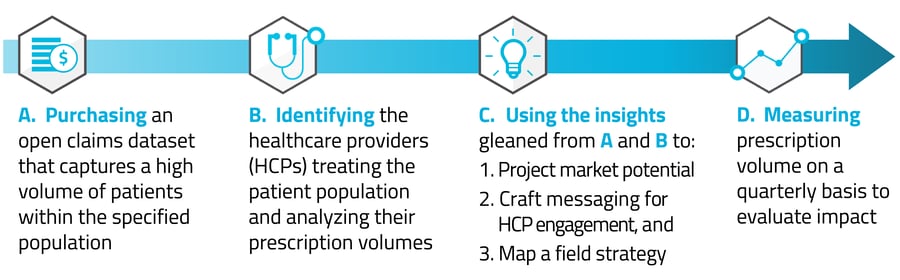
While this methodology has had varying degrees of success, significant weaknesses within open claims data result in information gaps and puzzling inconsistencies that seriously hinder commercial strategies. For example, since open claims data doesn’t fully capture the longitudinal patient journey — including the pathway from diagnosis to treatment — there’s very limited opportunity to proactively identify patients who may be eligible for (but not receiving) therapeutics and the HCPs who make these treatment decisions. This issue is especially problematic for the growing field of precision medicine, where it’s crucial to reach patients prior to therapy decisions. And while prescription volume is an indicator of therapy adoption, it only sheds light on the HCPs that are in specialties assumed to be prescribing. A whole universe of HCPs that interact with patients, refer to specialists, and influence care pathways is ignored.
In With the New: Fit-for-Purpose RWD
Real-world data (RWD) encompasses a multitude of sources to most closely capture and reflect the complete patient journey. This includes open and closed claims data for both medical and pharmacy (near-real-time retail, specialty, and mail-order) encounters. The open claims data, which is collected from clearinghouses and switch outlets, reflects a huge volume of claims, provides quick insight into trends via low lag times, and maximizes patient capture. And the closed claims data, which is ingested directly from payers, serves as the source of truth: It captures the full enrollment period and complete patient journey (that often spans multiple years of the patient’s life) and contains only adjudicated claims — which validate the data's accuracy. Together, open and closed claims data offers a market view that neither can deliver on its own.
Because RWD is representative of the entire patient population, there is much lower reliance on projections; and because insights are multiplied, prescriptions are only one of many measurement tools. Commercial teams can see clinical signals they’ve never seen before, significantly enhancing the basic insights to which they’ve grown accustomed. Following are three examples of how RWD is shifting the paradigm on market assessments to enable more refined and precise strategies:
1. Accuracy: Do the Numbers Make Sense?Currently, the number of patients with one or more diagnosis claims captured in a dataset — commonly referred to as “counts” — is considered the most persuasive indicator of a dataset’s reliability. If based solely on diagnosis codes, however, the dataset may appear to capture 100% of the population or even more due to misdiagnoses and inaccurate coding. Given the numerous challenges with healthcare data, this type of claim just isn’t logical.
Graph A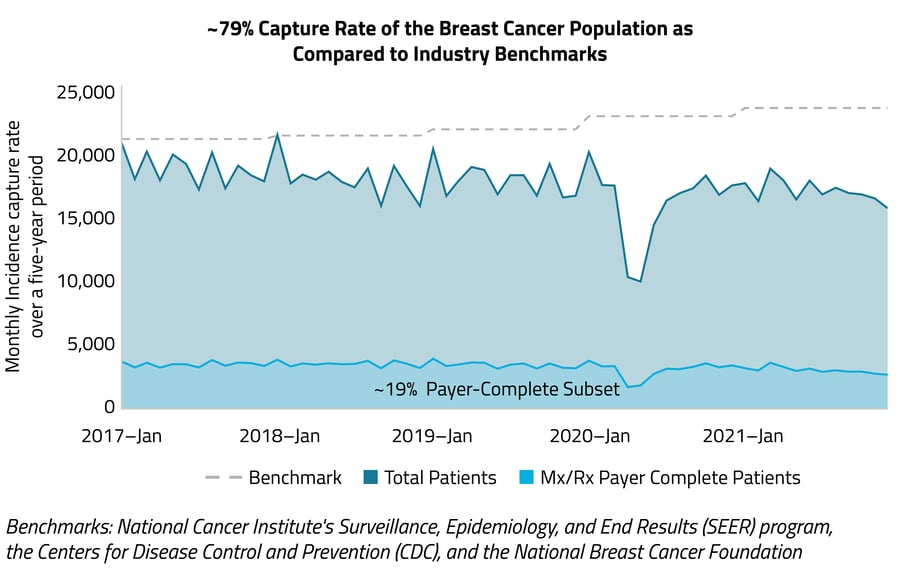
A more stringent approach to assessing a dataset’s capture of the population is to use strict inclusion criteria that mirrors the typical patient’s healthcare journey. In Graph A, the following inclusion criteria is used to ensure patients are highly vetted:
- 2+ breast cancer diagnosis dates
- 1+ visit with an oncology specialist
- 1+ treatment (surgery, chemotherapy, or hormone therapy)
A payer-complete subset is then used to validate that the capture rate is both plausible and defendable. Because payer-complete data captures all clinical, medical, and pharmaceutical interactions across multiple payers, HCPs, HCOs, and sites of care, it delivers a definitive, highly reliable view of market dynamics. In this example, the subset captures all claims from six months pre-diagnosis to six months post-diagnosis for ~19% of the patient population, mirroring (confirming) what is seen in the broader data.
Last, high-quality RWD combines data sources via third-party tokenization to ensure there is no double counting of patients, increasing the confidence level even further. (The use of an objective source that specializes in tokenization reduces the risk of “splits,” where one patient has more than one token, and “collisions,” where two patients are under the same token.)
2. Transparency: Am I Seeing the Whole Picture?A patient journey can span months or years, depending on the diagnosis/disease. While open claims data offers better insight into overall prescription volume, closed claims data is needed to see the entire patient experience and validate (or negate) any inferred trends.
Graph B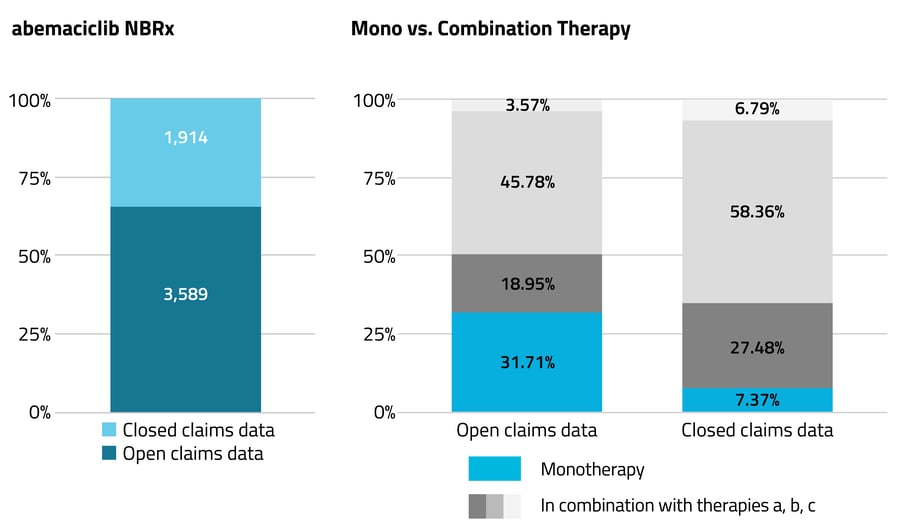
For example, when assessing the use of abemaciclib, a CDK inhibitor prescribed for the treatment of advanced or metastatic breast cancer, the 2021 volume of open claims data is nearly 2x that of closed claims data, and indicates abemaciclib was prescribed ~32% of the time as a monotherapy and ~68% as a combination therapy. But the closed claims data, which captures the complete patient journey, offers a more accurate picture of market share: Abemaciclib was actually prescribed as a monotherapy for only ~7% of the population and as a combination therapy for ~93%.
3. Depth: What Insights Are Hidden in the Numbers?Using RWD enables the patient population to be viewed at both national and subnational levels; by payer segment, healthcare-resource utilization, and costs; as well as through the lens of social determinants of health and race and ethnicity (R&E). These multifaceted views are important for fueling market access and health-equity initiatives.
Graph C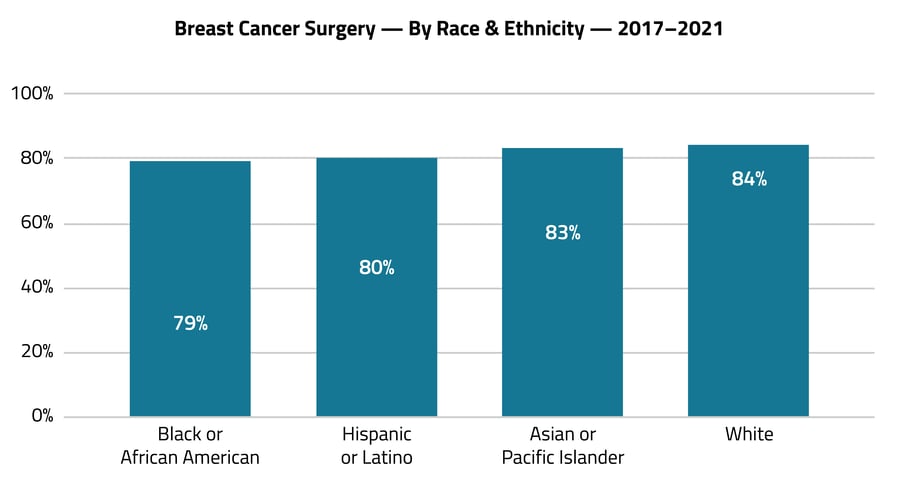
Graph D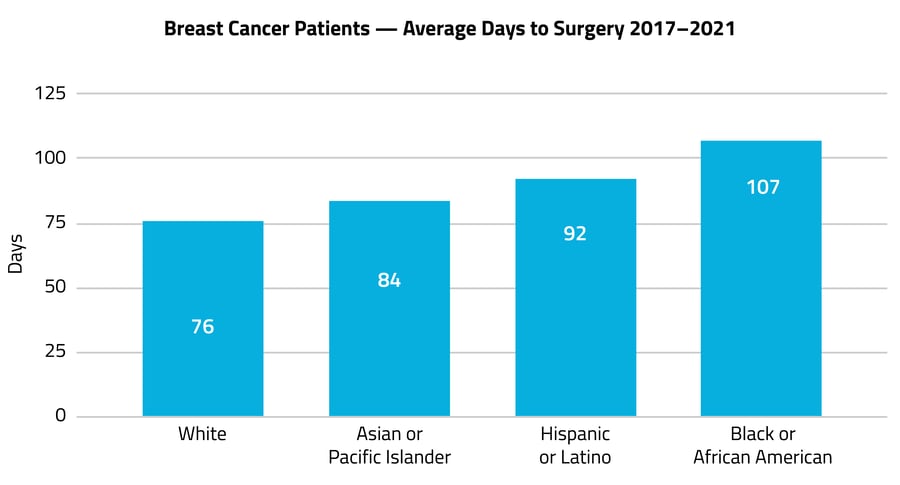
For example, as seen in Graph C, R&E insights reveal that patients of color in the breast cancer population are less likely to receive breast cancer surgery than are White patients. Graph D further reveals that R&E plays a role in how long patients wait for surgery, with Black or African American patients waiting a month longer than White patients, on average.
These types of insights enable commercial teams to investigate treatment disparities and work to address them. By comparing and contrasting the patient journeys of each population and identifying the primary care providers, specialists, surgeons, and payers that intersect, teams can devise medical-education and market-access strategies that drive health equity.
Pursuing Precision
It’s an exciting time for pharma commercial teams. Similar to commercial teams in other industries, they can now identify patients’ needs before patients are even aware of them and, with laser precision, proactively reach the providers who can improve, extend, and save their lives. The key is data science; more specifically, insights into the longitudinal patient journey and patient-level demographics, with real-time data and artificial intelligence capabilities. Understanding what’s possible and available is the first step.
About the Author: Prior to Komodo, Meghana Sundaresan worked with several pharma and biotech organizations to design commercial strategies for launching therapies and repositioning existing offerings to optimize growth. She now works closely with Komodo’s commercial customers to meet their critical data and analytics needs.
To learn how closed-claims data surfaces hidden HCPs that influence therapy adoption,  .
.
To see more articles like this, follow Komodo Health on Twitter, LinkedIn, or YouTube, and visit Insights on our website.
Share this: